
Exploratory Data Analysis in Python: A Full Walkthrough on a Real Dataset
Exploratory Data Analysis (EDA) is the process of examining a dataset — through summaries, statistics, and visualizations — before building any model, in order to understand its structure, spot problems, and uncover patterns.
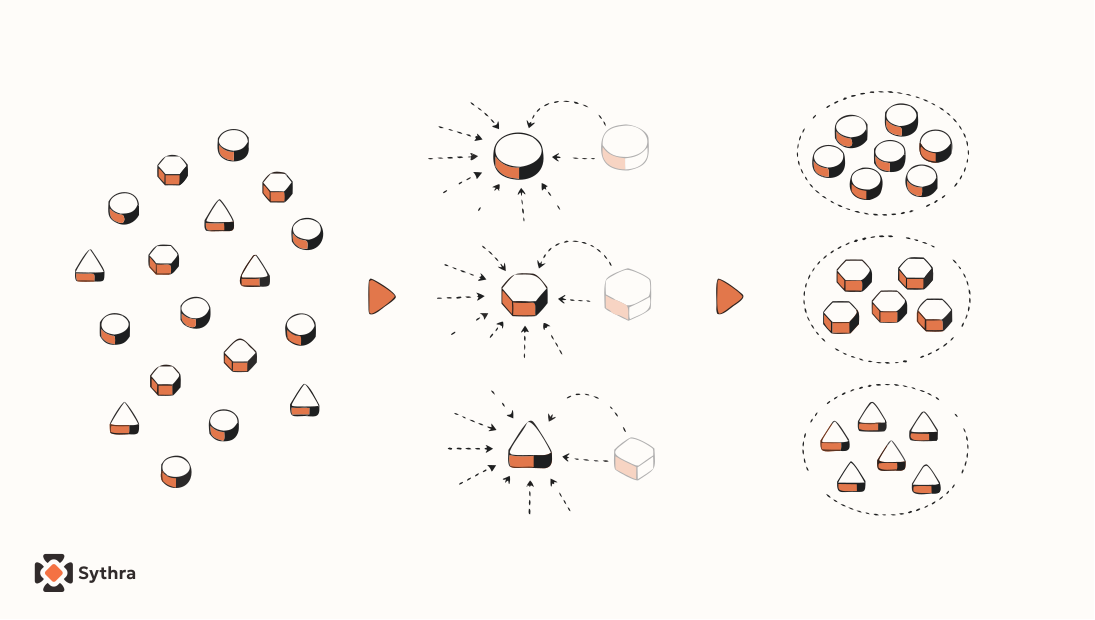
Exploratory Data Analysis (EDA) is the process of examining a dataset — through summaries, statistics, and visualizations — before building any model, in order to understand its structure, spot problems, and uncover patterns.
Why It's Used
Here's a trap almost every beginner falls into: opening a dataset, immediately jumping to model.fit(), and hoping for the best. This usually backfires. You might not notice that one column is 40% missing values, that another has a typo creating a fake category, or that your "numeric" price column secretly contains the text "N/A" hiding in a few rows.
EDA is the step where you actually look at your data before trusting it. It's the difference between a doctor examining a patient before prescribing medicine, versus just handing out the same pill to everyone who walks in. Skipping it doesn't make problems disappear — it just means you find out about them later, in the most confusing way possible: as a model that mysteriously performs badly.
Intuition
Imagine you just moved into a new house and someone handed you a box of unlabeled keys. Before you start trying every key in every lock (that's model-building), you'd probably first sort through the box: how many keys are there? Do any look identical? Are any bent or broken? Is there a tag on any of them hinting what they open?
That sorting-through step is EDA. You're not solving the problem yet — you're just getting familiar with what you're working with, so that when you do start solving it, you're not wasting time on broken keys or duplicates.
In data terms, this usually means asking a handful of simple but crucial questions: How many rows and columns do I have? What do the columns actually mean? Are there missing values? Are there weird outliers? Are certain categories way more common than others? Do any two columns seem to move together? None of these questions require fancy algorithms — just curiosity and a few basic tools.
The Math
EDA isn't really about deriving new formulas — it's about applying a handful of foundational statistics to understand your data. Here's a quick refresher on the two you'll lean on most:
Mean (the average):
Add up every value, divide by how many there are. Tells you the "center" of your data.
Standard deviation (how spread out the values are):
In words: for every value, find how far it is from the mean, square that distance (so it's always positive), average all those squared distances, then take the square root to bring it back to the original units. A small means values are clustered close to the mean; a large means they're spread out widely — which is often your first clue that outliers might be present.
A quick, related idea worth knowing here: a value is often flagged as a potential outlier if it sits more than a certain number of standard deviations away from the mean — commonly:
This isn't a strict rule, just a common rough threshold — a value further than 3 standard deviations from the mean is unusual enough to be worth a second look.
Code
Let's run a full EDA pass on a small, realistic dataset of employee records.
import pandas as pd
import numpy as np

# A small, slightly messy real-world-style dataset
data = {
    "employee_id": [1, 2, 3, 4, 5, 6, 7, 8],
    "age": [25, 32, 45, 29, np.nan, 38, 41, 120],   # 120 is likely a data entry error
    "department": ["Sales", "Engineering", "Sales", "HR", "Engineering", "Sales", np.nan, "HR"],
    "salary": [45000, 72000, 68000, 51000, 80000, 47000, 62000, 53000]
}
df = pd.DataFrame(data)
print(df)
# STEP 1: Basic shape and structure
print(df.shape) # (rows, columns) -> a quick sense of scale
print(df.info()) # column names, types, and non-missing counts, all at once
print(df.describe()) # mean, std, min, max, and quartiles for numeric columns# STEP 2: Checking for missing values
print(df.isnull().sum()) # how many missing values, per column# STEP 3: Checking categorical columns for weirdness
print(df["department"].value_counts(dropna=False))
# dropna=False makes sure missing values show up in the count too, not hidden# STEP 4: Spotting outliers using the mean/standard-deviation rule
mean_age = df["age"].mean()
std_age = df["age"].std()
df["age_is_outlier"] = np.abs(df["age"] - mean_age) > 3 * std_age
print(df[["employee_id", "age", "age_is_outlier"]])# STEP 5: Visualizing distributions and relationships
import matplotlib.pyplot as plt
import seaborn as sns
fig, axes = plt.subplots(1, 2, figsize=(10, 4))
# Histogram: how salary values are distributed
sns.histplot(df["salary"], bins=5, ax=axes[0])
axes[0].set_title("Salary Distribution")
# Boxplot: a quick visual for spotting outliers in age
sns.boxplot(y=df["age"], ax=axes[1])
axes[1].set_title("Age Spread (Outlier Check)")
plt.tight_layout()
plt.show()Example / Output
Running df.isnull().sum() would print something like:
employee_id    0
age            1
department     1
salary         0
dtype: int64
Immediately, you know exactly where your gaps are — one missing age, one missing department — before you've written a single line of modeling code.
Running the outlier check would print something like:
   employee_id  age  age_is_outlier
0            1   25            False
1            2   32            False
2            3   45            False
3            4   29            False
4            5  NaN            False
5            6   38            False
6            7   41            False
7            8  120             True
That 120 immediately jumps out as flagged — almost certainly a typo (perhaps someone meant 20, or a stray extra digit), and something you'd want to fix before training any model on this data.
Advantages and Disadvantages
| Advantages | Disadvantages |
|---|---|
| Catches data problems early, before they quietly wreck a model | Can be time-consuming on very large or very messy datasets |
| Builds genuine understanding of what each column represents | Easy to go too deep and spend excessive time exploring instead of building |
| Helps decide which features are actually useful before modeling | Visualizations can be misread or overinterpreted without domain knowledge |
| Often reveals insights that are valuable on their own, independent of any model | Doesn't replace careful statistical testing where it's actually needed |
Common Mistakes / Misunderstandings
- Treating EDA as optional or a "nice to have." Skipping it doesn't save time — it usually costs more time later, debugging a model that's behaving strangely for reasons that were visible in the data all along.
- Only looking at
.describe()and stopping there. Summary statistics can hide problems — a column can have a perfectly reasonable-looking mean while still containing wild outliers or missing chunks. - Assuming every "outlier" is automatically wrong. Sometimes an extreme value is real and meaningful (a genuinely huge sale, a genuinely rare event) — EDA flags candidates for review, it doesn't hand you final verdicts.
- Not checking categorical columns for inconsistent spelling.
"Sales","sales", and"Sale"might all be meant as the same category but will be treated as three different ones unless you catch it here.
Try This Yourself
Take the employee dataset above and add one more row where "department" is spelled "sales" (lowercase) instead of "Sales". Rerun value_counts() and see it get counted as a completely separate category. This tiny experiment shows exactly why EDA — really looking at your categories — matters before any modeling begins.
Want to go deeper? You can learn all of this properly, step by step, on our website.
Summary
- EDA means examining your dataset thoroughly — structure, missing values, outliers, and distributions — before building any model.
- Basic tools like
.shape,.info(),.describe(), and.isnull().sum()reveal most obvious problems in seconds. - Mean and standard deviation aren't just abstract stats — they're practical tools for spotting values that look suspicious.
- Visualizations (histograms, boxplots) often reveal patterns and problems that raw numbers alone can hide.
- Good EDA isn't about fancy techniques — it's about genuine curiosity applied consistently, every single project.
Common questions
What is EDA in machine learning?
EDA (Exploratory Data Analysis) is the process of examining a dataset before building a model — checking its shape, missing values, distributions, and potential outliers — so you understand what you're working with and can fix problems early.
What tools are used for EDA in Python?
The most common tools are Pandas (for .info(), .describe(), .isnull().sum(), and value_counts()), NumPy (for mathematical checks), and Matplotlib/Seaborn for visualizations like histograms and boxplots.